|
Hello! Last week we had such a great day during our Pi Day celebration! Students created a Pi banner, participated in a Scavenger Hunt and also many Pi-themed review activities. Thank you to all those who brought in goodies for students to enjoy. The pies/cakes/cookies were delicious! Last week we also began Module 5 on Statistics and Probability. This week we will continue by finishing up Lesson 2 - Estimating Probabilities by Collecting Data. We talked about the Probability Scale which ranges from 0 - 1 or 0% - 100%. 0 or 0% represents impossible events, while 1 or 100% represents certain events. Flipping a coin and getting heads, for example would represent and Equally Likely outcome (0.5 or 50%). 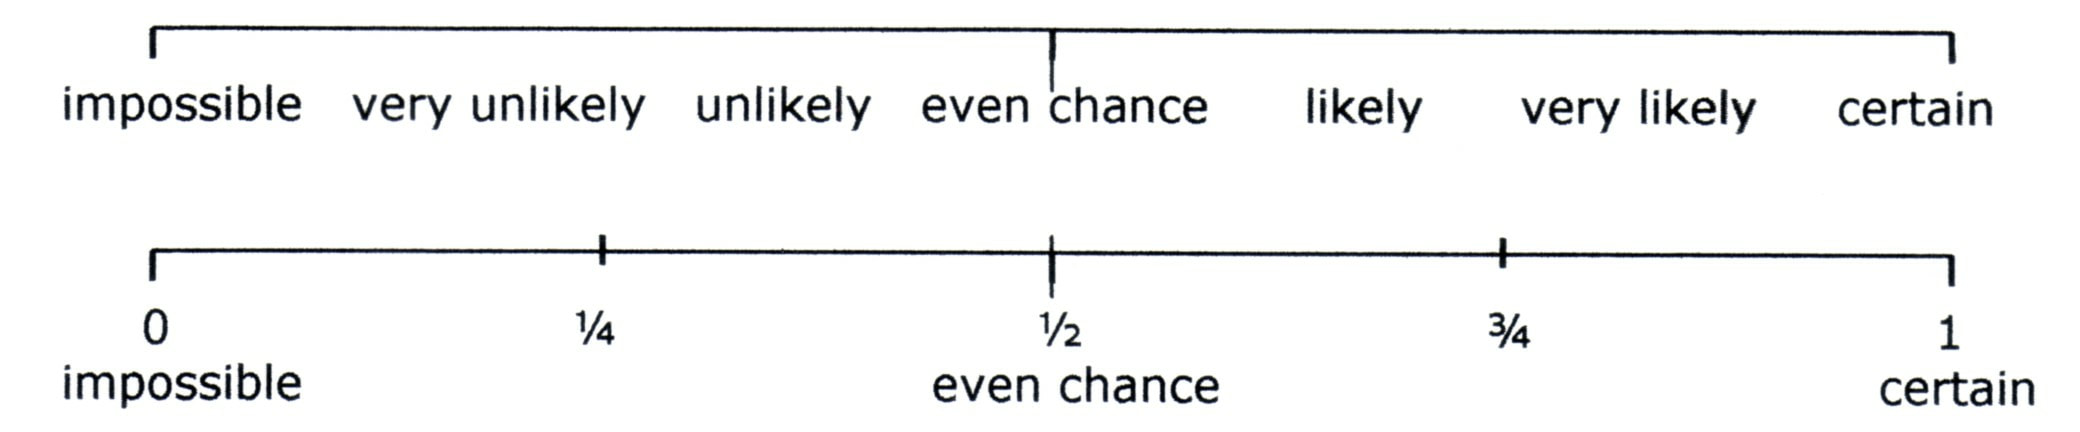 Last week we also practiced using spinners to generate data from which to estimate probabilities.
To be covered this week... Lesson 3 & 4 - Chance Experiments with Equally Likely Outcomes Lesson 5 - Chance Experiments with Outcomes That Are Not Equally Likely Lesson 6 - Using Tree Diagrams to Represent a Sample Space Here is a great video overview of Probability that students can view to reinforce what we are learning in class. A few other "basics" of probability that will be important for students to learn... Experimental vs Theoretical Probability (click here for another explanation) What is an Outcome? Sample Space? and other definitions How to determine Probability using "or" & "and" What is a Tree Diagram? This week's Quizizz code is 753302. It is a review of percents. Don't forget to complete by Thursday night! Happenings this week: Honor Roll Assembly - Wed. at 10:50. Rock Your Socks Day - Thurs. 3/21 Twin Day - Fri. 3/22 Looking Ahead... Book Fair - Week of April 1st Have a great week! |